In the following example, your main office is located in New York and you have a branch offices in Detroit and Washington. The branch office in Washington is connected over the WAN. Furthermore, the Washington branch office has a satellite office in Dallas.
Your IT Administrator has identified the potential bottlenecks in the data pipe where the Zone Access Points (ZAPs) should be located. The Zone Access Points (ZAPs) denote where you need to measure the bandwidth between the zones. The IT Administrator has assigned the following bandwidth limits for the voice media streams through the ZAPs:
|
ZAP Label |
Bandwidth Limit |
|
Atlanta-New York (ZAP ID 1) |
500 kBits/s |
|
Atlanta-New York (ZAP ID 2) |
500 kBits/s |
|
Detroit-New York |
750 kBits/s |
|
Washington-New York |
750 kBits/s |
|
Dallas-Washington |
1024 kBits/s |
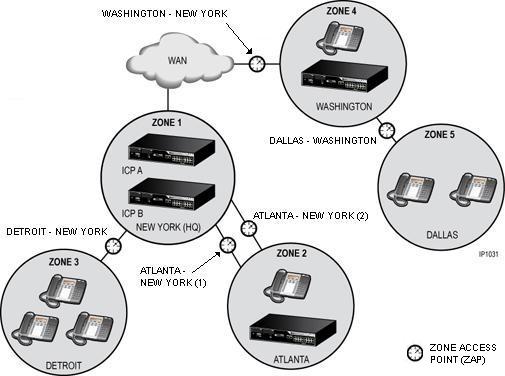
In this example, you want to manage the ZAPs from the Detroit, Atlanta, and Washington office from the Headquarters office in New York. Washington will manage the ZAP from the Dallas office. The following diagram shows a physical representation of the voice network:
Complex Network: Physical Representation
Next, you create a zone tree diagram that identifies the parent zones and the zones that are belong to that parent. ZAPs are represented by the tree branches that connect each zone. Use the zone tree diagram to identify where call bandwidth will be recorded. For example, a call from the Dallas office (Zone 5) to the New York office (Zone 1) traverses the following ZAPs:
Dallas-Washington
Washington-New York
The bandwidth statistics for the call is recorded at these ZAPs.
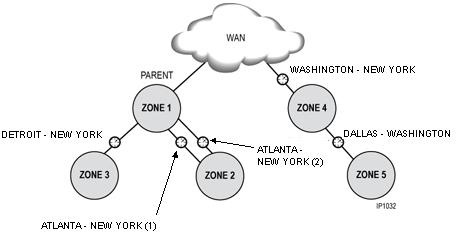
The above configuration simplifies the network into a tree representation model similar to a spanning tree where a voice packet path from any node to any node in the network is uniquely defined.
The configuration requires and makes the following assumptions:
The network is subdivided into zones as shown in the figure above.
Each zone is either connected to the WAN or to another zone.
Access to any zone is through a single Zone Access Point (ZAP); this may be a WAN connection, a VPN link to another zone, or a similar arrangement.
Bandwidth utilization across any ZAP is managed by a single ICP, usually located within the zone.
If more than one ICP exists in a zone, one ICP must be assigned as a gateway with all calls streaming in and out of the ZAP being routed through this gateway. This gateway also provides the Bandwidth Management for the ZAP.
If a call streams across more than two ZAPs, the call is routed through all ICPs that manage the intermediate ZAPs traversed by the media stream.
The parent zone for each zone is identified in the following table:
|
Zone (Tree node) |
Parent Zone |
|
1 |
None |
|
2 |
1 |
|
3 |
1 |
|
4 |
1 |
|
5 |
4 |
Completed Network Elements and Network Zone Topology Forms
|
Network Element |
|
Zone Tree Assignment |
|||
|
Name |
Zone |
|
Zone ID |
Parent Zone ID |
Perimeter Zone |
|
New York (Local) |
1 |
|
1 |
None |
No |
|
Atlanta |
2 |
|
2 |
1 |
No |
|
Detroit |
3 |
|
3 |
1 |
No |
|
Washington |
4 |
|
4 |
1 |
No |
|
Dallas |
5 |
|
5 |
4 |
No |
|
Zone Access Point Assignment (Summary) |
|||
|
Zone Access Point ID |
Zone Access Point Label |
Bandwidth Limit (kBits) |
Network Element |
|
1 |
Atlanta-New York (1) |
500 kBits/s |
New York - ICP A |
|
2 |
Atlanta-New York (2) |
500 kBits/s |
New York - ICP B |
|
1 |
Detroit-New York |
750 kBits/s |
New York - ICP B |
|
1 |
Washington-New York |
750 kBits/s |
New York - ICP A |
|
1 |
Dallas-Washington |
1024 kBits/s |
Washington |