Data is collected at the managed points in the network or at the Zone Access Points (ZAPs). You can see what is happening in real time at any ZAP in the network should there be any problems or congestion. You can also look at information kept for either 15-minute or hourly intervals. This information is stored so that you can retrieve it to assess the trends and usage over a period of time.
Using the following forms to monitor statistics:
Current Bandwidth Statistics to see real-time bandwidth usage
Hourly Historical Bandwidth Statistics provides access to hourly historical data
Bandwidth Historical 15 Minute provides access to data recorded at 15 minute intervals
You can use the Export button in the Current Bandwidth Statistics, the Hourly Historical Bandwidth Statistics, or the Bandwidth Historical 15 Minute forms to save the statistics in a .CSV-format file for use in a spreadsheet. See Exporting Form Data for the procedure on how to do this.
You can use a spreadsheet program, for example Excel 2000, to interpret and graph the results of the bandwidth data exported to a .CSV file.
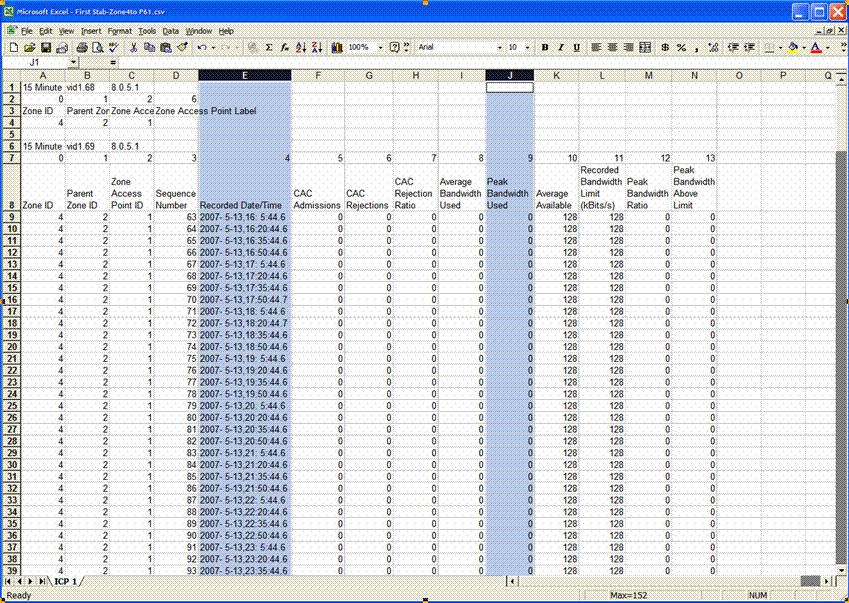
Open the exported .CSV file in Excel.
Select the Recorded Date/Time field and the statistics that you want to chart, for example Peak Bandwidth.
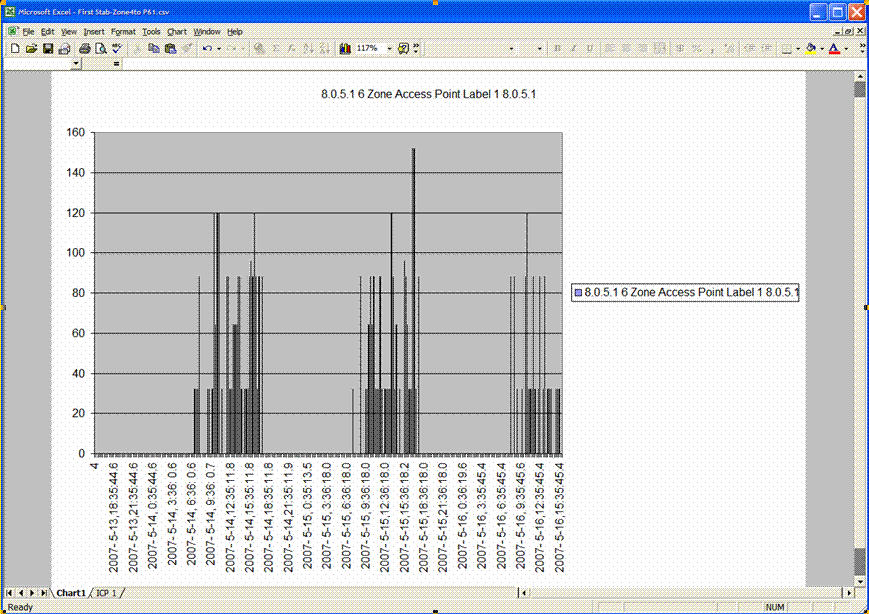
Click the Insert menu and then click Chart.
Ensure that the Chart Type: Column and the Chart sub-type: Clustered Column are selected.
Click Next twice, and then in the Chart Options dialog add a chart title and choose the desired chart options. Click Next again.
Select As New Sheet in the Chart Location dialog and then click Finish for the results.
BWM STATISTICS RESET command deletes all 15-minute and hourly intervals stored in persistent storage on the 3300 ICP. It also resets the cumulative counters to zero. If the Bandwidth Statistics & Reporting option is enabled in the Bandwidth Management form, then the historical data resumes with the expiry of the next 15-minute interval. See BWM Statistics Reset.
Note: If the time and date of the 3300 ICP has been changed, use this command to reset bandwidth management statistics.
It is possible to access Bandwidth Statistics through SNMP. Both the real time data and the historical data is available. Because the number of historical records can be very large (in the order of tens of thousands of entries), it is recommended that directed queries of the data in the tables be performed, rather than an SNMP WALK of the historical tables.
For an ICP managing a large number of ZAPs, the network manager can use a script (for example, a stats collection job) that walks the Table for the current day's statistics in the table, or the current day's entries for a particular ZAP, but not the entire table. For a system with few ZAPs, the data could be collected less frequently.
To illustrate, here is a troubleshooting example: Since the ICP stores a month's worth of hourly statistics in the database, if the network manager became aware of problem in performance of the network on Friday that occurred on Tuesday, then it would be pertinent to collect all entries from the 24-Hour Historical Table for the Tuesday time period, not the entire table.
These types of intelligent queries will ensure that data is collected in the most expedient fashion.